


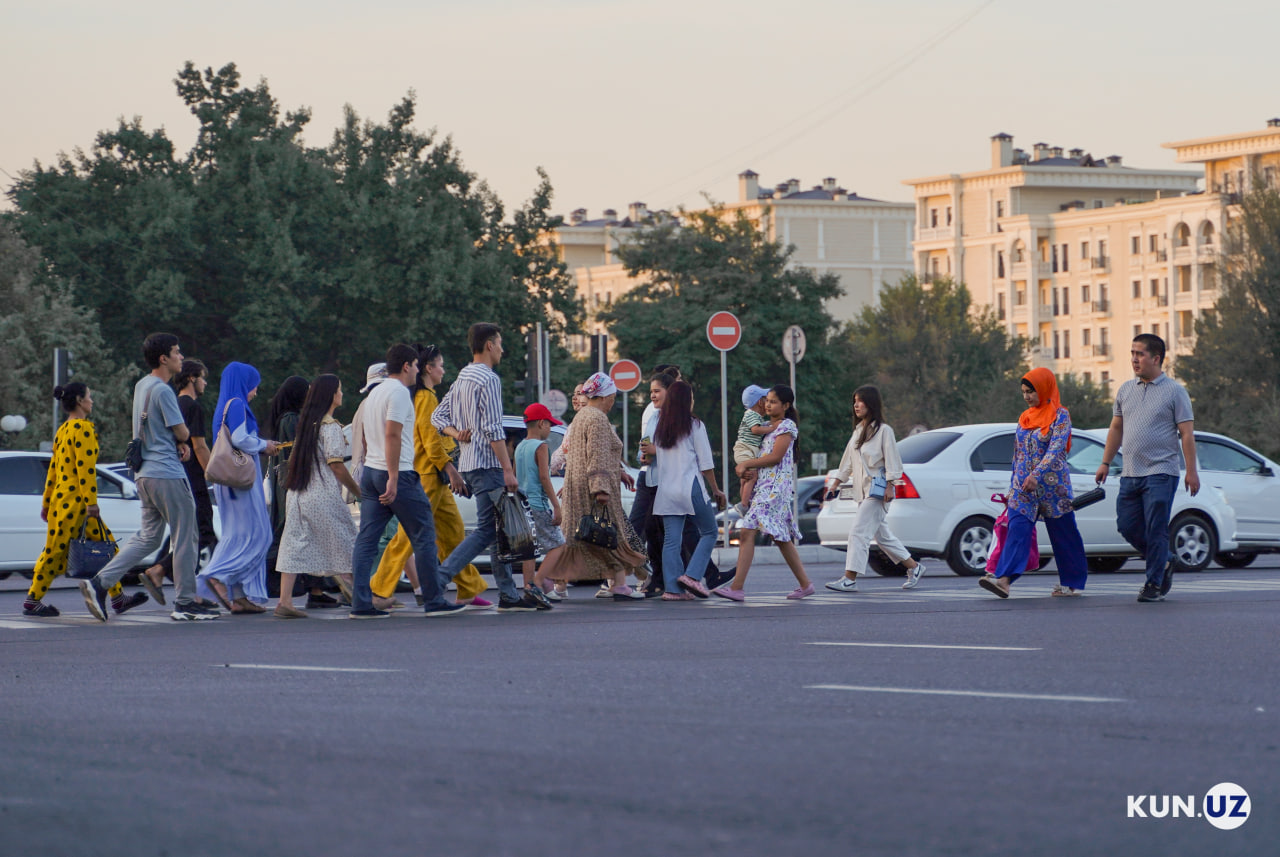
Uzbekistan's population density nearly doubled since 1991
Population density in Uzbekistan has been steadily increasing year by year, according to recent data from the National Statistics Committee. As of January 1, 2025, the average population density in the country reached 83.6 people per square kilometer.
Here’s the population density trend by year:
- 1991 – 46.1 people/km²
- 1995 – 50.2 people/km²
- 2000 – 54.6 people/km²
- 2005 – 58.0 people/km²
- 2010 – 62.4 people/km²
- 2015 – 69.1 people/km²
- 2020 – 75.5 people/km²
- 2025 – 83.6 people/km²
Population density per square kilometer by region (As of April 1, 2025):
- Republic of Karakalpakstan – 12.2
- Andijan region – 807.9
- Bukhara region – 51.8
- Jizzakh region – 72.8
- Kashkadarya region – 128
- Navoi region – 9.9
- Namangan region – 422.7
- Samarkand region – 257.3
- Surkhandarya region – 147.3
- Syrdarya region – 218.3
- Tashkent region – 206.2
- Fergana region – 615.7
- Khorezm region – 337.1
- Tashkent city – 6,983.2
Population figures
As of April 1, the permanent population of Uzbekistan was 37.7 million people – an increase of 2% compared to the same period in 2024.
Breakdown:
- Women – 18.7149 million
- Men – 18.9829 million
- Urban population – 19.2164 million
- Rural population – 18.4814 million
According to forecasts, 223,900 people are expected to die in Uzbekistan in 2025. The average life expectancy in the country stands at 74.3 years. More than half of all deaths are attributed to cardiovascular diseases.
As of January 1, the number of women aged 15 to 49 in Uzbekistan was 9.424 million. This figure has shown steady growth over the years:
- 1991 – 4.8212 million
- 1995 – 5.4185 million
- 2000 – 6.289 million
- 2005 – 7.1722 million
- 2010 – 7.9454 million
- 2015 – 8.6493 million
- 2020 – 8.9823 million
- 2025 – 9.424 million
Demographic dynamics, especially the increase in the number of women of reproductive age, are considered key indicators for shaping policies in healthcare, education, and labor planning.
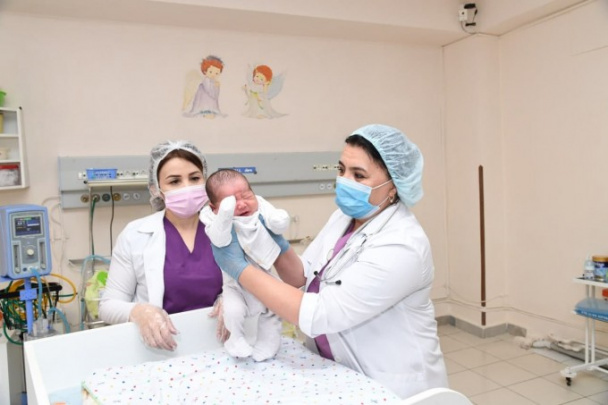
Birth statistics (January–April 2025)
From January to April 2025, a total of 266,478 live births were registered across Uzbekistan. By region:
- Samarkand – 32,118
- Fergana – 30,371
- Kashkadarya – 29,792
- Surkhandarya – 24,599
- Andijan – 23,513
- Namangan – 22,843
- Tashkent region – 20,698
- Tashkent city – 20,023
- Khorezm – 12,447
- Bukhara – 12,390
- Karakalpakstan – 11,896
- Jizzakh – 11,787
- Navoi – 7,367
- Syrdarya – 6,634
2024 birth statistics
In 2024, 926,400 children were born in Uzbekistan – 479,500 boys and 446,900 girls. For the first time since 2018, the annual birth rate declined. The number of births dropped not only compared to 2023 but also to 2022.
The decline in births affected all regions. Despite a sharp decrease, Surkhandarya still had the highest birth rate, while Karakalpakstan had the lowest. The decline was more significant in urban areas than in rural ones. For instance:
- In cities:
- 2023 – 480,200 births
- 2024 – 454,500 births
- In rural areas:
- 2023 – 481,800 births
- 2024 – 471,900 births
Marriages and divorces
In 2024, 271,800 marriages were registered in Uzbekistan – a 15-year low. Even in 2010, there were more (292,300). This suggests that the number of marriages has not kept pace with population growth.
Of those married:
- 136,700 (50.3%) lived in urban areas
- 135,100 (49.7%) lived in rural areas
The average age at marriage increased:
- Men – 27.1 years
- Women – 22.3 years (both up by 0.1 years compared to 2023)
Regions with the highest number of marriages:
- Samarkand – 31,400
- Kashkadarya – 29,200
- Fergana – 29,200
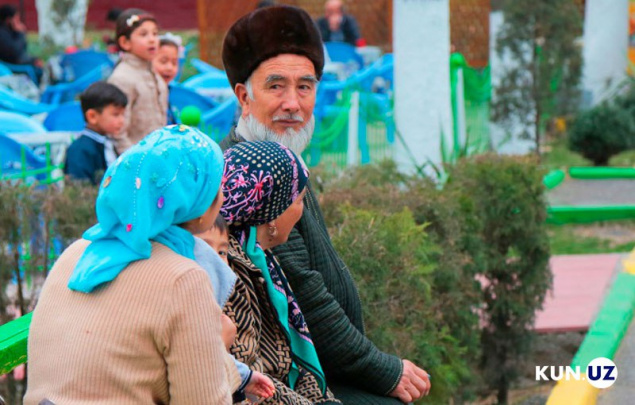
Life expectancy
Life expectancy at birth in Uzbekistan reached 75.1 years in 2024. Historical trend:
- 1991 – 66.4 years
- 1995 – 69.1 years
- 2000 – 70.8 years
- 2005 – 71.8 years
- 2010 – 73.0 years
- 2015 – 73.6 years
- 2020 – 73.4 years
- 2024 – 75.1 years
Life expectancy by region:
- Tashkent city – 76.8 years
- Fergana – 76.6 years
- Bukhara – 76.3 years
- Jizzakh – 76.0 years
- Navoi – 75.8 years
- Tashkent region – 75.1 years
- Samarkand – 74.8 years
- Namangan – 74.6 years
- Khorezm – 74.6 years
- Kashkadarya – 74.4 years
- Surkhandarya – 74.0 years
- Andijan – 73.7 years
- Karakalpakstan – 73.0 years
- Syrdarya – 72.2 years
Related News
20:08 / 08.07.2025
Uzbekistan’s permanent population nears 38 million
14:52 / 30.05.2025
Samarkand tops birth statistics in Uzbekistan for early 2025
17:06 / 24.05.2025
Life expectancy in Uzbekistan sees steady growth over decades

12:35 / 22.05.2025